
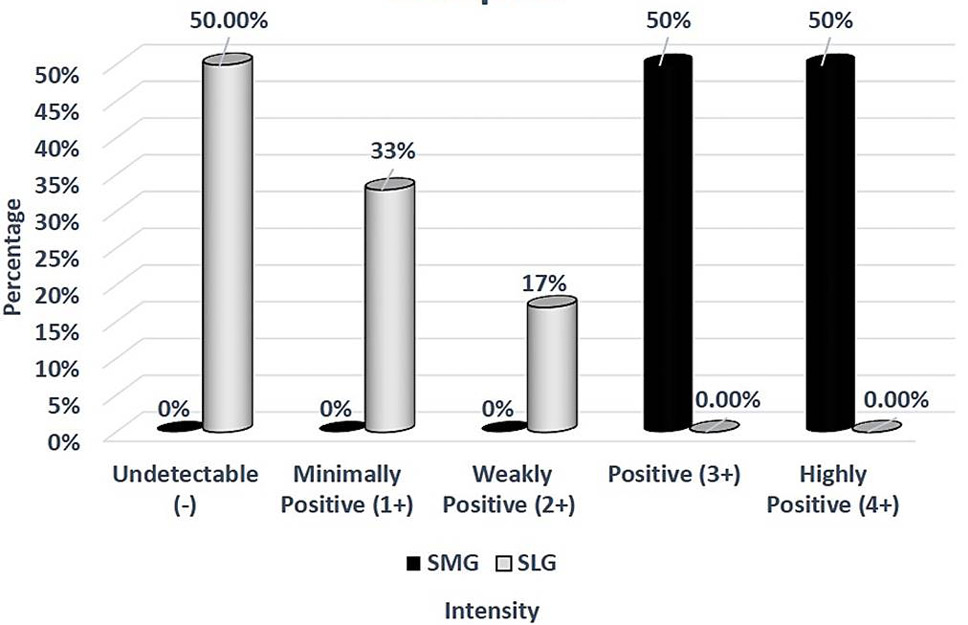
Fig. 4.
Comparison between SMG and SLG of control Group A2 (week 9): Among SMGs 50% (n=3/6) showed intensity score of 4+ (highly positive) and 50% (n=3/6) showed a score of 3+ (positive). While among the SLGs 17% (n=1/6) showed a score of 2+ (weakly positive), 33% (n=2/6) showed a score of 1+ (minimally positive) and 50% (n=3/6) showed an undetectable score showing that TGF-α expression is more in ductal epithelial cells of SMG as compared to SMG. When TGF-α expression of SMG and SLG of control group (A2) at week 9 was compared with each other, Fisher’s exact test showed a statistically significant association between them. P-value was found to be p=0.006.